Office day, 2012
One working day in the Iota office,
read from the sensors left running in it.
This study is anchored to a place: the sensors
stay put, and people and their devices move.
“People, places, and things serve as observational anchors; activity is common to all three.”
Of the three, the same paper says that “attending to a place foregrounds changing presence and use”.
On 17 August 2012 the team left 21 sensors
running in the office for a working day.
Eight Bluetooth loggers from about 10:40, then spiders for sound, light and air, Grid-EYEs for heat, and Kinects for people, the last at 16:05.
What survives is the logs, and the viewer the team wrote to replay them. The viewer places all of it in the office, and the data agrees as far as it can be tested. No plan, notes or photographs of the day have been found.
With no plan to go by, the day reads as a proof
of concept: was the approach viable?
Could sensors left in a room give a useful picture of a day, with nothing carried for the study? And what kind of picture would it be?
What follows is cases and patterns from these devices on this one day. Its numbers describe them and measure nothing beyond them.
Four kinds of sensor were placed,
each hearing or seeing something different.
8 Bluetooth loggers
Asked, about every 10 seconds, what could answer, and wrote it down.
3 Kinects
A point for each person tracked, under an id that lasts while it holds on.
4 Grid-EYEs
8 × 8 readings of heat, from above or from the wall.
6 spiders
Four recorded sound in seven bands; two recorded light and air, one of them motion too.
A Bluetooth logger hears a device nearby.
It does not say where the device is.
- Only a device set to answer can be heard, so many phones never show.
- A device heard is not a person. A computer can be left on a desk. Whether the team set its own to answer isn't recorded.
- Here the radio carried across most of the office, so a device's track is coarse: which loggers hear it most, and when that changes.
The team's viewer drew every sensor
its own way, in one model of the office.
| Bluetooth logger | A box, its size and color by how much its last scan heard |
|---|---|
| Kinect | Its view in orange, and a small box at each reading of the last 10 s |
| Grid-EYE | Its view in green, and 64 colored squares where the view meets the floor |
| Spider | A row of bars, one for each channel |
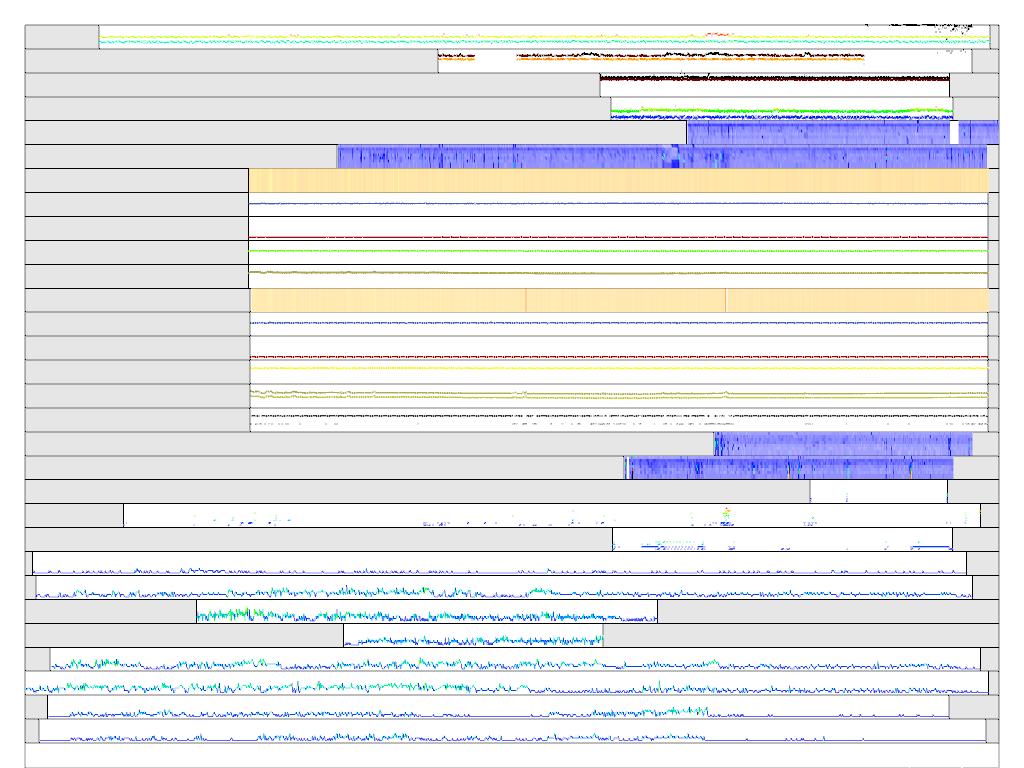
The viewer stacked every sensor in one timeline and saved this picture of the day.
Each device stamped its own time, and two
loggers ran an hour and two hours fast.
“Placing sensors in one room does not, by itself, make their measurements compatible.”
Their files' own dates say so, and so do their logs. Played as stamped, a phone seems to move from one logger to another an hour apart. On one clock, the two hear it together.
A coarse track still shows when a device
arrives, leaves, or changes ends.
- A phone is heard from 10:43, almost only by two loggers. At 11:25 all eight hear it within two minutes, and then it is gone.
- A computer falls silent at every logger for 17 minutes from 13:46, then returns.
- Two computers stop within about a minute of each other, at 15:26 and 15:27.
No list of the study's devices survives,
so they are sorted by how they were heard.
6
Stayed
Heard in 30 minutes or more: five computers and a phone.
6
Returned
Fewer minutes, on two visits or more, over 10 minutes apart.
63
Passed
One visit, nearly always within seconds, heard most near the brick wall.
The sensors' places are the team's,
and the logs and the room bear them out.
Kinects
Their people land on open floor, as placed, and in walls at most other headings.
Loggers
Those that stand closer hear more in common, and few other assignments fit as well.
Grid-EYEs
Warm where the Kinects put people, once their picture is turned a quarter.
These patterns are observations,
and a model of a working day is still to be made.
“An observation is not an activity model.”
The front page's model for this study is device-level tracks through one working day. Such tracks can be read here, as far as they go. What they mean about the day's work would have to be proposed and tested.
As a way to see a day the approach held up.
It can't say where a device was, or whose.
- It shows which computers were in the office, when one left or moved, and that phones go by.
- It needs nothing carried for the study, only devices set to answer, and those included people with no part in it. These logs hold their device names, kept out of this page.
- One day, one office, and a few devices: this describes them, and measures nothing beyond them.
The logs and the viewer survive,
and nothing written about the day.
| Logs | 8 loggers, 3 Kinects, 4 Grid-EYEs and 6 spiders, each part of the day, all from 17 August 2012 |
|---|---|
| The viewer | Its source, its sensor places and file list, its model of the office, and one saved timeline |
| Not found | A plan, notes, photographs of the day, or a list of the devices and who held them |
Every claim here traces to the logs,
the viewer, or TJ.
- The logs, read with the viewer's own rules, with no address or name published.
- The viewer, iotaLabViewer, as built on 4 October 2012: its code, sensor places, file list and saved timeline.
- The model of the office, the same as the open house's, file for file. TJ, 5 November 2026.
- McLeish, Computational Design and Modeling Activity, 2026.