The napkin dispenser study
asked what one everyday object
could say about the people using it.
Iota put small wireless sensor modules on dispensers in a small independent coffee shop, in the winter of 2010–11, and logged what they read.
The anchor is a thing: the sensing is on the object, and the object is the focus. A whiteboard of December 2010 gives the premise: “sensing simple things has value in aggregate”.
Anchoring an activity to a thing
is one way into a model of it.
“A framework for doing so was anchoring the activity from the perspective of the person, place, or thing.”
“Activity is not a 4th idea, it is what is common across all three. Models of activity.”
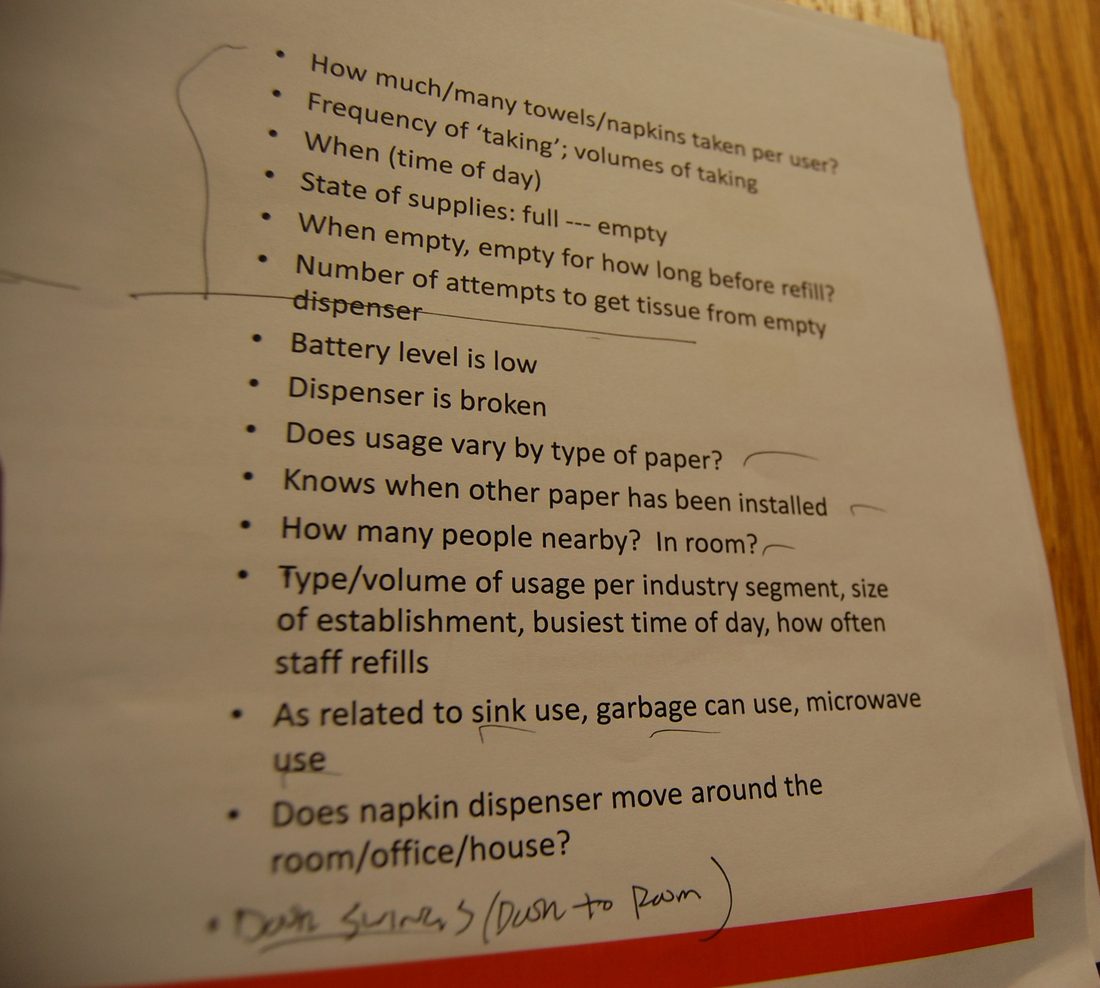
The study's list
sets six questions apart.
Above a pencil line: how many taken per user, how often, when, how full, how long until a refill, attempts on an empty dispenser. These went into the proposal.
Below it: a low battery, a broken dispenser, type of paper, people nearby, staff refills, and use of the sink, the garbage can and the microwave.
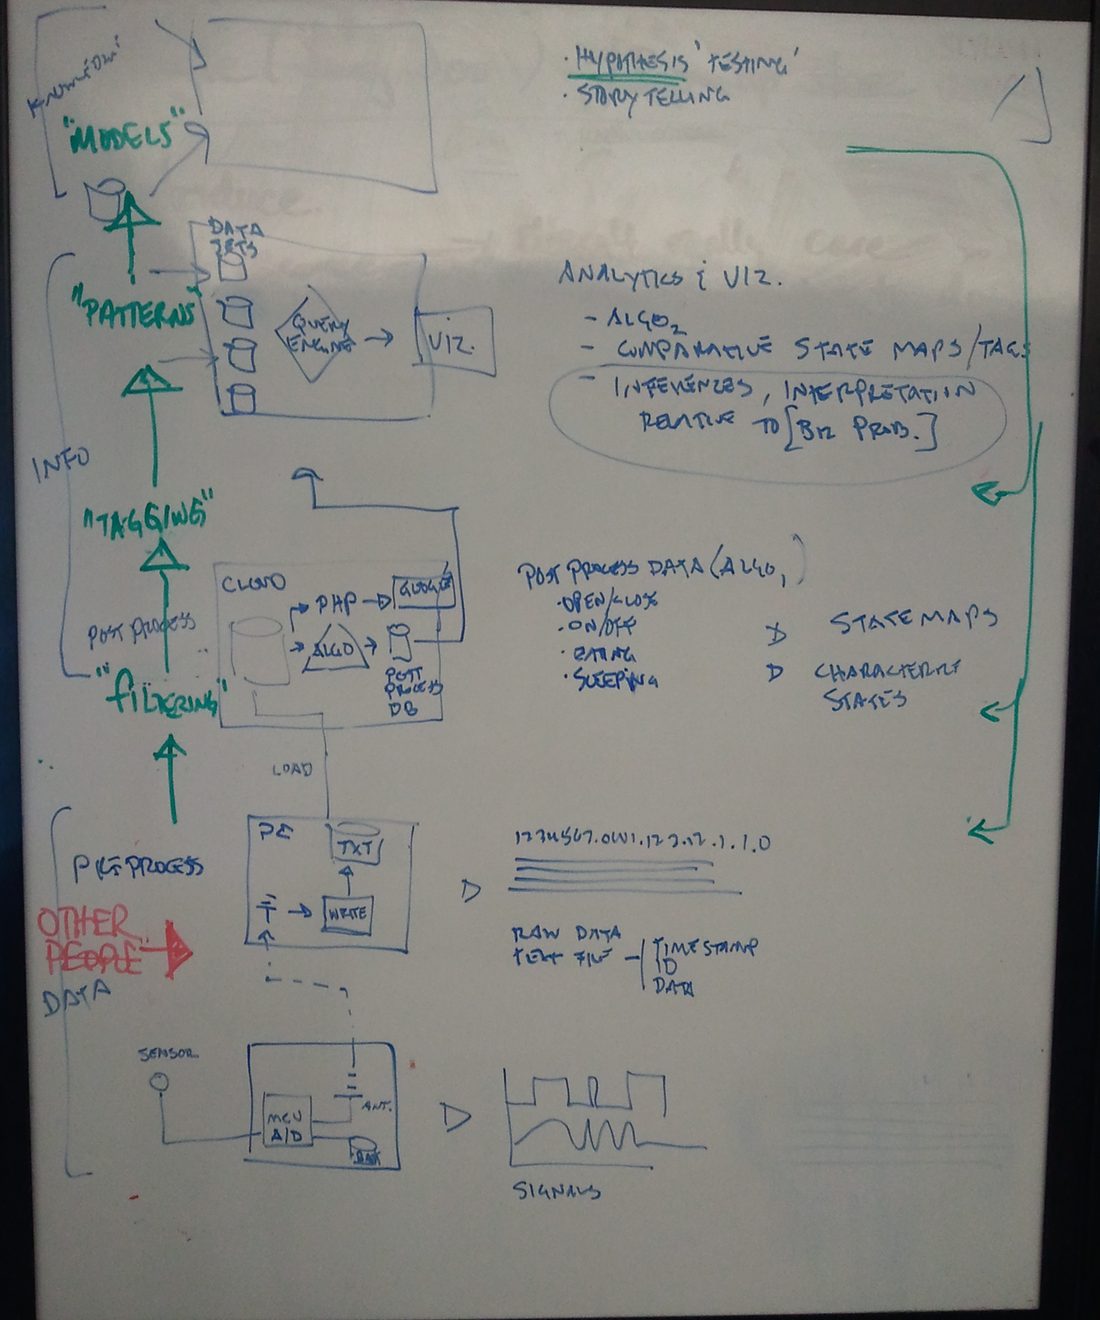
A whiteboard climbs
from signals to models.
Signals, then a raw text file of timestamp, ID and data.
Then “filtering”, “tagging”, “patterns” and “models”, with “state maps” of states such as open/close and on/off.
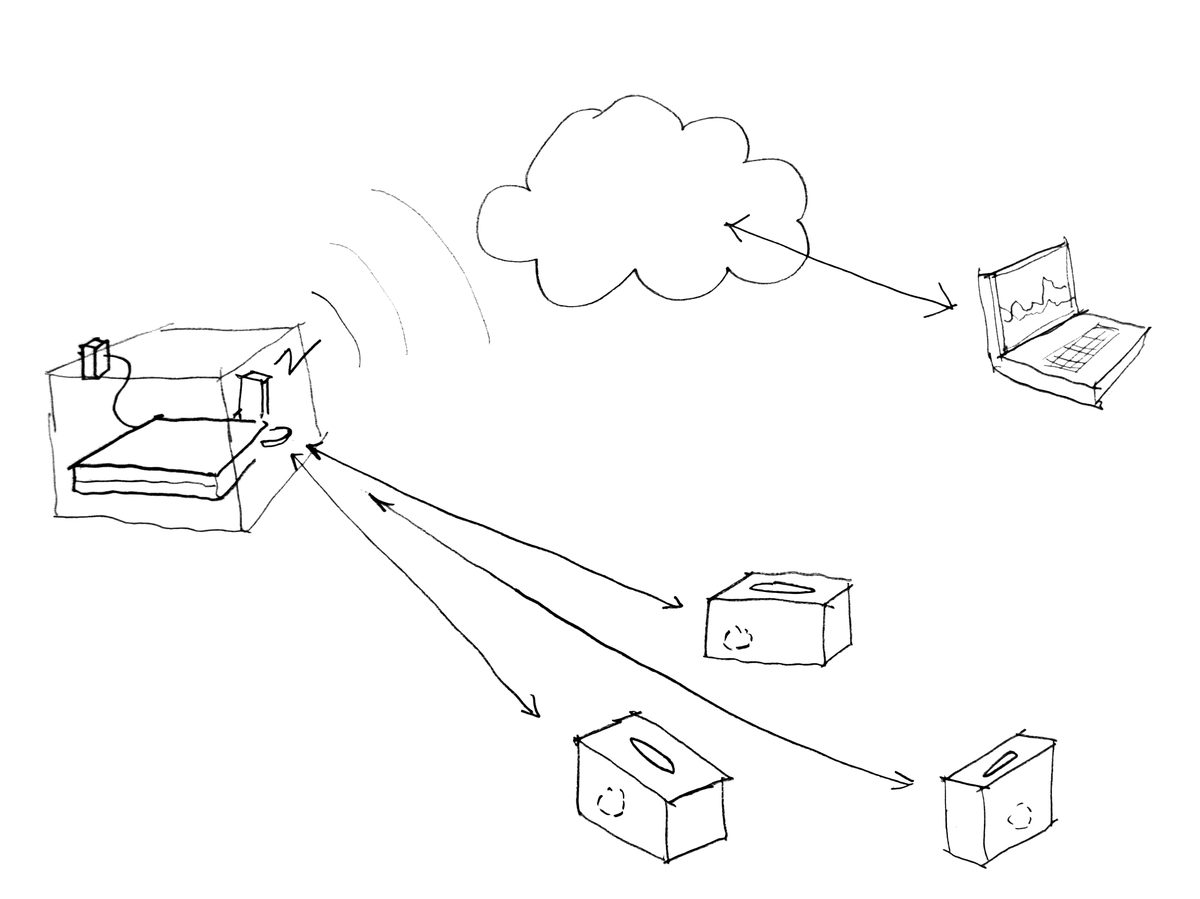
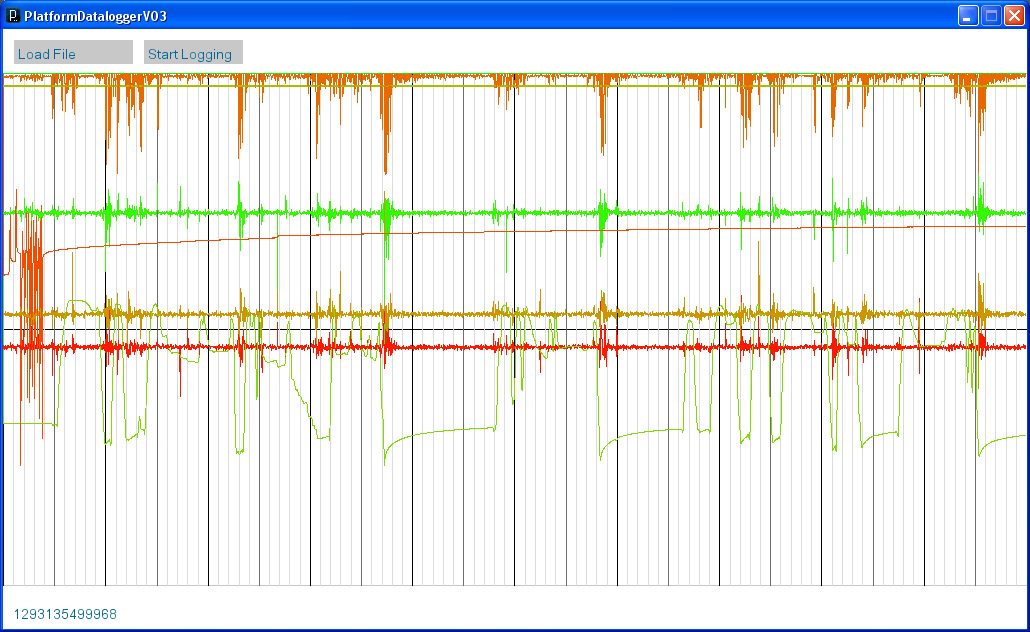
Modules radioed their readings to a PC
that logged them with the time.
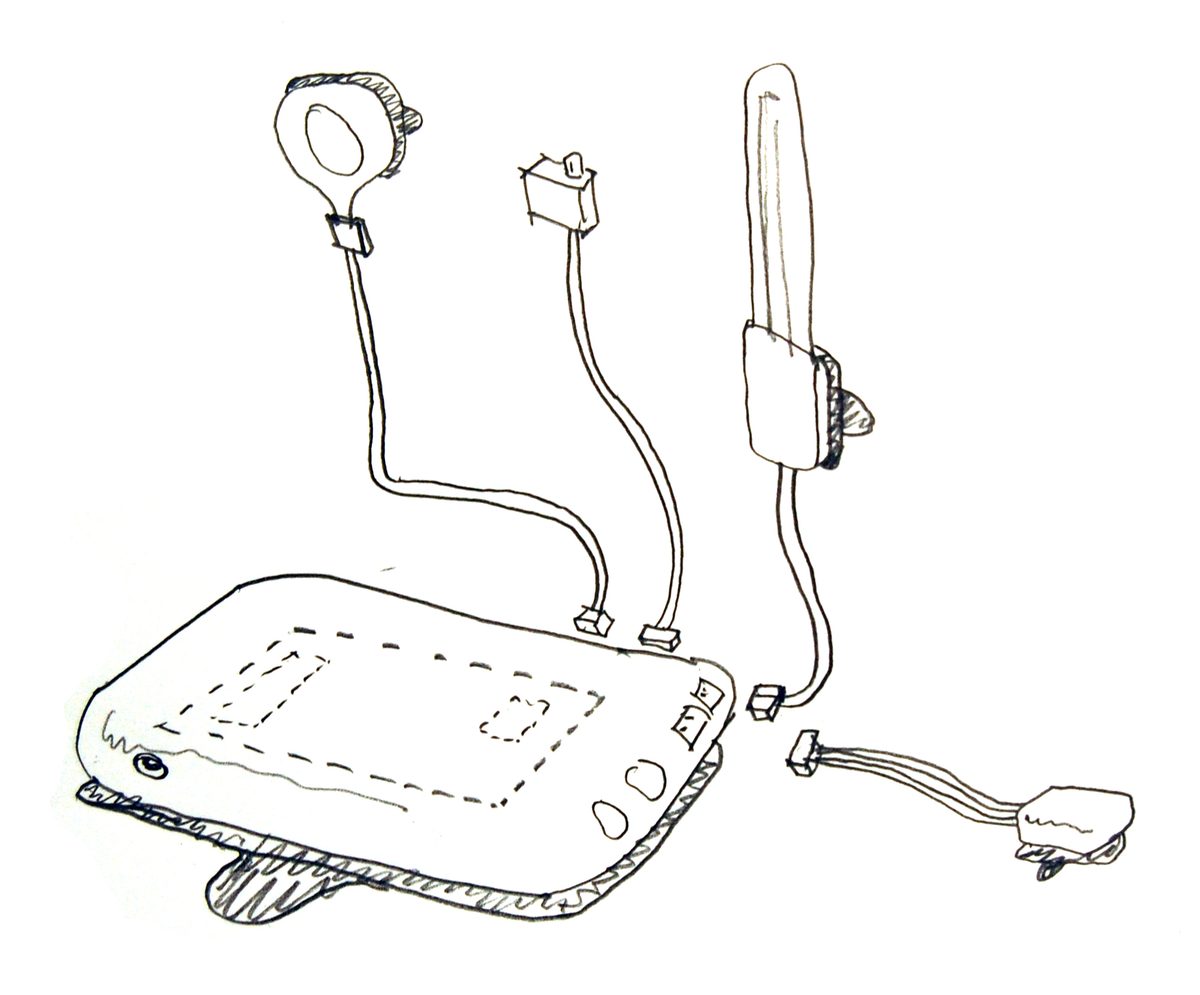
Eight inputs, about eight times a second: an accelerometer, a battery level and jacks for plug-in sensors.
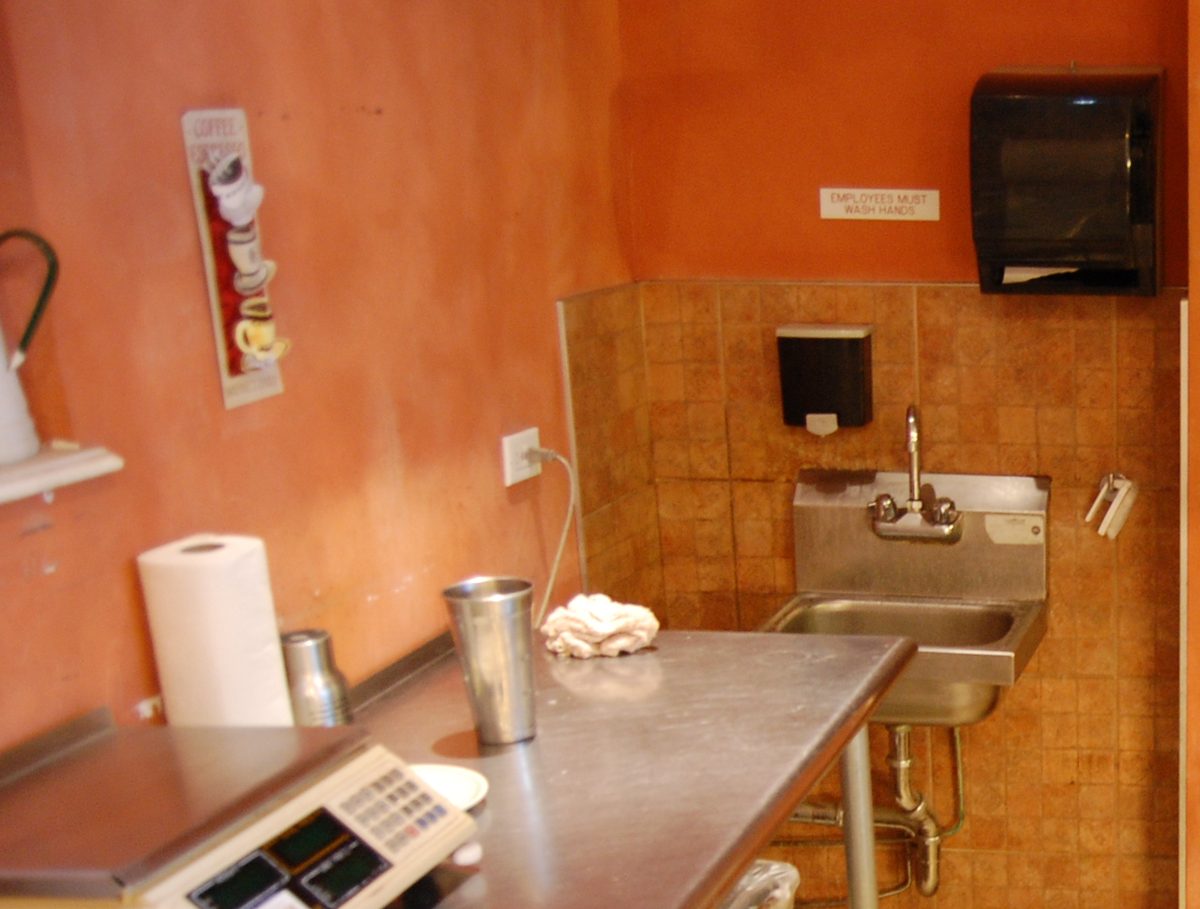
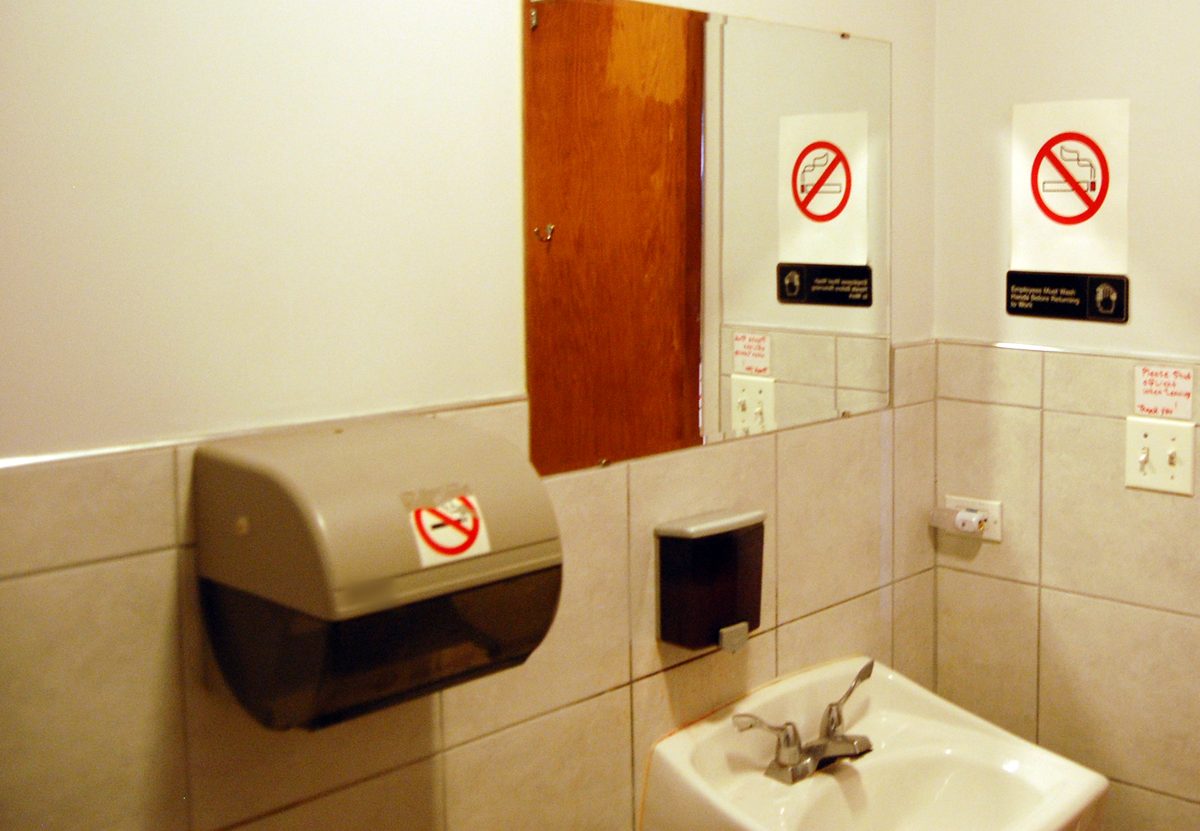
The photographs show two towel dispensers,
and not which module sat on which.
Seven sessions survive from March 2011,
and the logger stops on the 22nd.
| Session | Clock | Readings | Pictures |
|---|---|---|---|
| Mon 14 March | 15:29–16:01 | 52,286 | none |
| Tue 15 March | 14:24–15:05 | 73,309 | none |
| Thu 17 March | 14:17–21:52 | 524,872 | none |
| Sat 19 March | 11:52–16:15 | 342,888 | the shop from 13:26, busy |
| Sun 20 March | 13:04–13:20 | 12,618 | the shop from 13:13 |
| Mon 21 March | 13:16–20:03 | 657,752 | the shop from 13:44, quiet |
| Tue 22 March | 07:27–14:45 | 573,012 | the shop, a working morning |
An earlier run, 5 to 20 February,
does not read as dispensers.
A quiet afternoon sets the limits:
one person in the pictures, for 13 minutes.
| Module | Largest, to 15:55 | Limit | Largest, from 15:55 | Movements | Steps |
|---|---|---|---|---|---|
| 101 | 27 | 30 | 25 | 0 | 0 |
| 102 | 27 | 30 | 28 | 0 | 0 |
| 103 | 36 | 39 | 37 | 0 | 0 |
| 104 | 30 | 33 | 28.5 | 0 | 0 |
A touch is a jolt or a lasting step
past those limits.
- A jolt: A0–A2 together, each against its running median over about 5 s, past the module's limit.
- A step: A4, A5 or A7, 10 s against the 10 s before, moved by 3 counts or more.
- Counted only while the module is in place and above its low-battery level.
- It means only that something moved the module or what it sat on.
Touches run from none on a quiet afternoon
to dozens an hour on a busy Saturday.
| Session | 101 | 102 | 103 | 104 |
|---|---|---|---|---|
| Mon 21 March, quiet | 0 in 5.0 h | 0 in 4.5 h | 0 in 5.2 h | 0 in 5.0 h |
| Tue 22 March, a working morning | 3 in 4.4 h (0) | not logged | 11 in 4.6 h (1) | 5 in 4.2 h (2) |
| Sat 19 March, busy | 2 in 0.5 h (0) | 37 in 1.7 h (1) | 4 in 0.8 h (0) | 57 in 1.3 h (4) |
| Thu 17 March, no pictures | 65 in 4.1 h (14) | 26 in 4.2 h (5) | 32 in 4.5 h (7) | 22 in 4.1 h (2) |
Someone is at the counter
at 87 of 110 touches,
and at 68 of 126 random moments.
| Span | Touches | Random moments | p |
|---|---|---|---|
| 22 March, modules 101, 103, 104 | 13 of 19 | 16 of 38 | 0.056 |
| 19 March, module 102 | 27 of 37 | 22 of 40 | 0.079 |
| 19 March, module 104 | 47 of 54 | 30 of 48 | 0.003 |
On the team's bench, half the movements
last three readings or more; in March fewer do.
At the March rate, under the same rule: 53 of 105 on the bench.
5 of 85 on 19 March, 3 of 9 on 22 March, and 28 of 118 on 17 March.
Nothing found says which module sat where,
though 102 and 104 shared a surface.
- All four turned over between 14 and 15 March, and hold their tilt within a degree in every session from then but 20 March.
- 102 and 104 jolt within 1 s of each other 5 times on 17 March and 7 on 19 March. Moved in time, the same lists agree at most 1 and 2 times. No other pair does.
- The picture does not place them: change around each module's movements stands out nowhere (smallest p 0.06).
One plug-in input climbs on days with people,
and holds on the quiet afternoon.
| Session | 101 | 102 | 103 | 104 |
|---|---|---|---|---|
| Mon 21 March, quiet | −2 | 0 | +2 | −1 |
| Tue 22 March, a working morning | −1 | not logged | +17 | +1 |
| Sat 19 March, busy | −2 | +15 | +31 | +15 |
| Thu 17 March, no pictures | +94 | +1 | +32 | +7 |
The model of activity stops at touches:
no reading tells a napkin from a bump.
Signals
survive
Raw text file
survives
Filtering
added in 2026: limits, counted time
State map
added in 2026: touches, by session
Tagging
no labels found
Patterns, models
not reached
Of the six questions above the line,
the readings answer two in part.
| How many taken, per user | No: one napkin, several and a bump look alike. |
|---|---|
| Frequency; volumes | Touches per hour, yes; volumes, no. |
| When, by time of day | For the hours counted, at most about five a session. |
| State of supplies | Not established: A5 climbs, for reasons not separated. |
| How long until a refill | Not seen. |
| Attempts on an empty dispenser | Not seen. |
Below the line, the readings speak to two
questions and leave the rest open.
| Battery level is low | Yes, if A3 is the battery, on three modules of four. |
|---|---|
| Dispenser is broken | Not seen. |
| Type of paper; other paper installed | No: no record of the paper, one shop. |
| People nearby, in the room | Not from the readings. The pictures could say. |
| Industry, size, busiest time, staff refills | No: one establishment, no refill identified. |
| Sink, garbage can and microwave use | No: not instrumented, as far as survives. |
| Does the dispenser move around | Little sign of it: the tilt holds in five sessions of six. |
The limits are those of the instruments,
the pictures and what was written down.
- Eight readings a second: a quick pull can fall between two, so counts are a floor.
- A charge lasted about seven hours, and its last hour is noisy and left out.
- The pictures are 320 × 240, the dispensers do not show, and one AI reader coded them.
- No note found says what was plugged in where.
The study stands on these files,
kept on TJ's drive.
- A list of questions, 28 November 2010. Lightweight Platform Prototype: Napkin Dispenser Monitor, Revision 2, 20 December 2010.
- A whiteboard, 22 February 2011. Iota Overview, © 2011 Iota Partners.
- Firmware demoPlatform_03G, 7 March 2011. Logger PlatformDataloggerV22G, March 2011.
- The logger's files, December 2010 to 22 March 2011. 663,290 webcam frames, 19 February to 26 March 2011, not published.
- Photographs of the shop, 3 February 2011. McLeish, Modeling Activity and Computational Design, 2026.