Measuring collaboration
An instrumented office, 2013, and a workspace platform, 2014
The deck runs from the question
to what survives of the answer.
- The ask and the anchor
- The method: from collaboration to turn-taking
- The 2013 study: nine instruments, 44 days
- What survives: one instrument, one day
- The 2014 platform and meeting fingerprints
- The students' chapter
- The model of activity
- Limits
- Sources
The ask was whether instruments could tell
what kind of meeting a room was having.
“Can we understand the qualitative aspects and typology of a meeting (informative, productive, evaluative) through instrumented means?”
The client wanted a new line of business: a service built on assessing offices and their work culture, with its own platform and instruments.
The study is anchored to a place,
and its model of activity is the meeting.
“People, places, and things serve as observational anchors; activity is common to all three.”
Here the instruments stayed where they were put, and the people in their view changed.
The 2013 study tested instruments
against one question: turn-taking.
“To determine the effectiveness of the GridEye, microphone, ambient environmental sensors, RescueTime and the Easy Button in revealing data that can elucidate questions regarding collaboration in spaces, specifically, occurrences of equal participation in terms of turn-taking.”
Collaboration cannot be measured as such,
so the team broke it into what can be.
| From its definition | Associated behavior | Measurable attribute |
|---|---|---|
| optimized rich and creative interaction | talking and listening | multiple people speaking |
| every member contributed comfortably to the conversation | turn-taking and confidence | cross-talk and over-talk |
| diverse voices participated equally | distributed turn taking | proportionality of speakers/attendees |
Repeats pointed to the instruments:
the microphone could serve 40 of 68 attributes.
Then the data had to be built back up,
from events to an understanding to an answer.
Event
3 people entered the room at 11:17am
Event
Conversation was sporadic and brief
Event
Meeting was rated poorly and 2 did not attend
Understanding
5 people were expected; meeting was brief; did not meet expectations
Insight
Poor team agility and unequal participation mean collaboration is low.
The instruments were thermal cameras,
microphones and ways of asking people.
Four Grid-EYE cameras of 64 pixels. Five spiders, with seven sound bands, temperature and air pressure.
Table-top buttons, a mobile survey, and logging on a few laptops. A Kinect took photographs to check against.
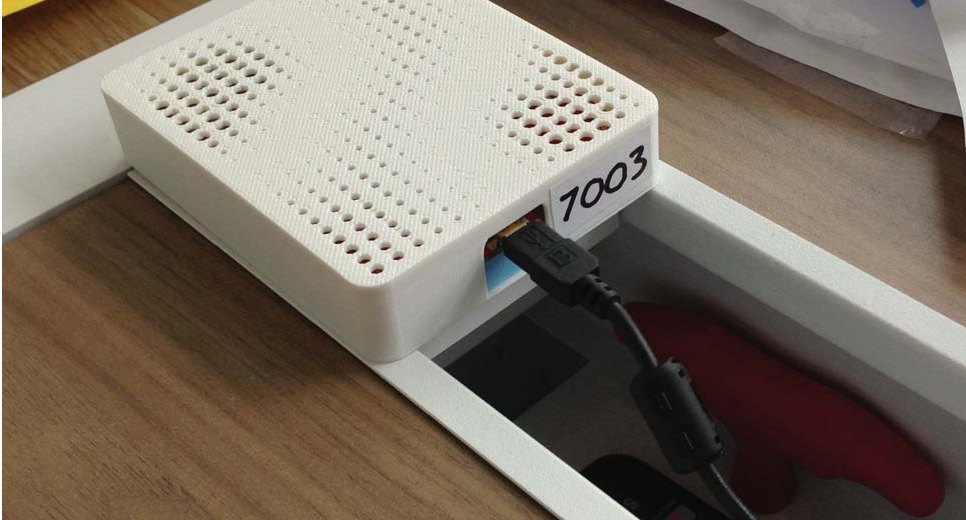
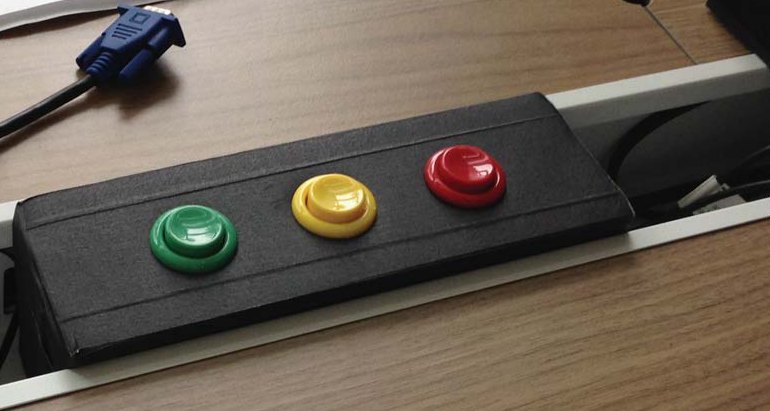
The instruments sat in three spaces,
each placed for a stated reason.
The entrance
A Grid-EYE thermal camera and a spider, to count people in and out, and to check the other sensors.
The social space
The same pair, above the coffee machine and near the television, for a sense of social activity.
The meeting space
Two Grid-EYEs, three spiders, table-top buttons and a Kinect, to measure behaviors that optimize collaboration.
The sensors were limited on purpose:
low resolution, low rate, several kinds.
“It’s not necessary to know everything to know something.”
“The sensors we use are intentionally limited – low resolution, low sampling rate, restricted (but diversified) data types.” The reasons given: “Privacy issues, avoiding analysis paralysis.”
Forty-four days made 45 GB of readings,
and very little that people reported by hand.
- Entries, eight a second
- 273,715,200
- Button presses
- 74
- Survey entries
- 9
- Opted in to logging, of 50
- 5
In the lab a Grid-EYE counted people past it
to about 95%, given the right placement.
| Actual entrances | Detected | Actual exits | Detected | |
|---|---|---|---|---|
| One person | 50 | 48 | 50 | 50 |
| Two walking close together | 50 | 48 | 50 | 52 |
| One person pushing a chair | 30 | 30 | 30 | 30 |
The microphones were tested by reading aloud,
in turns, in pairs and all together.
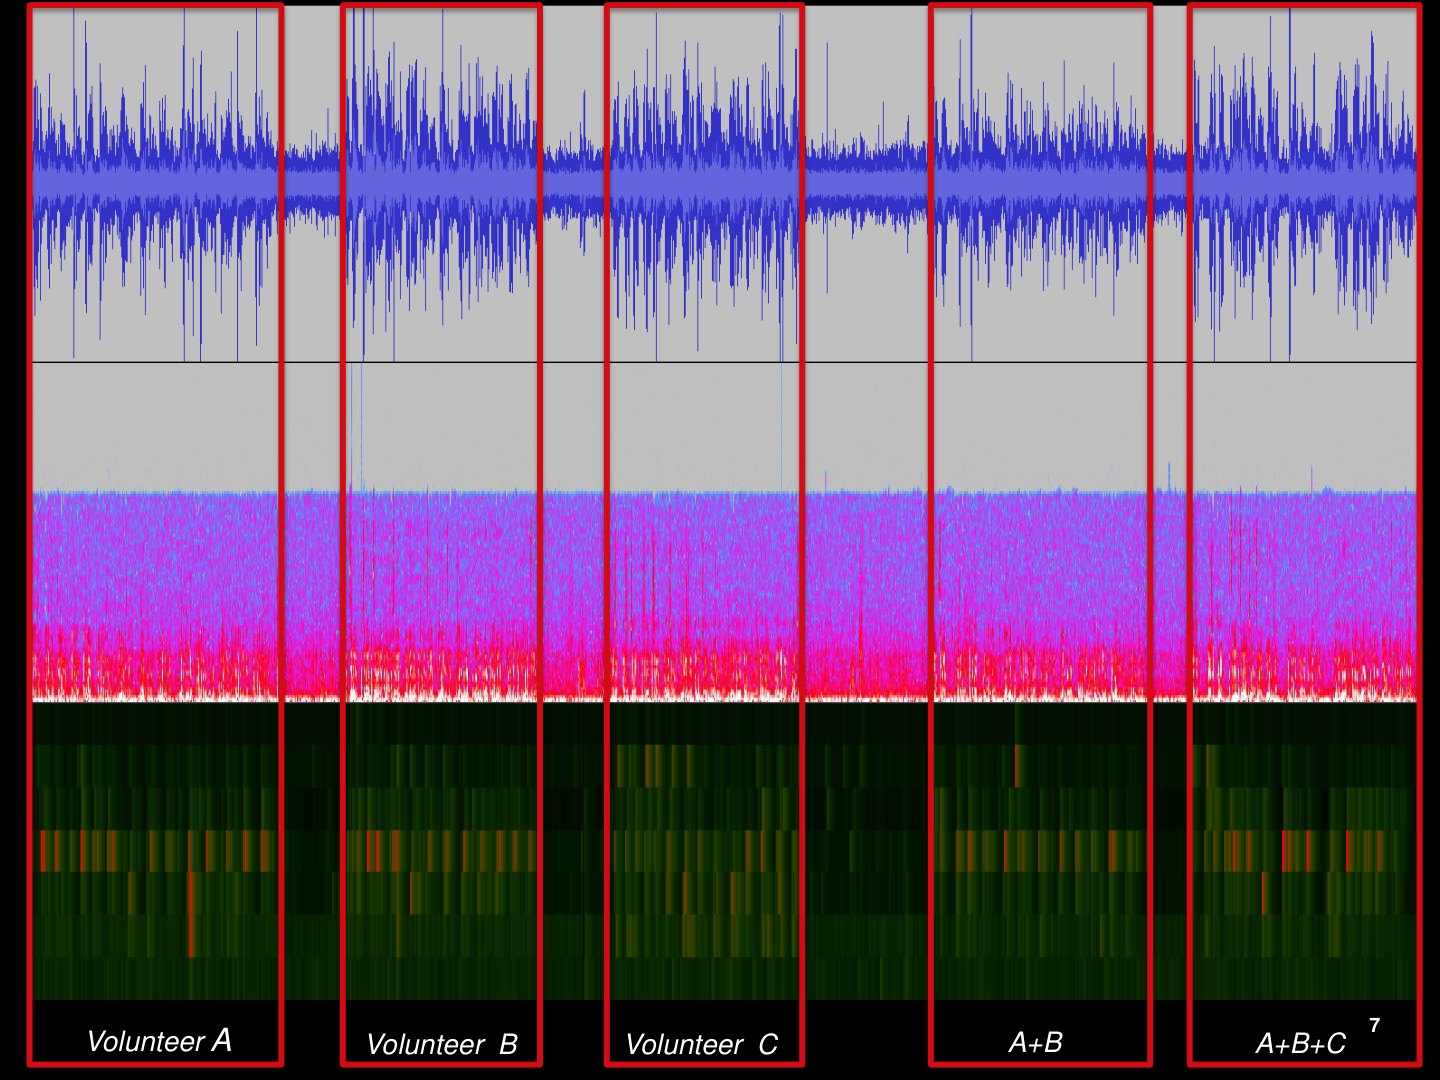
Three volunteers read from Green Eggs and Ham. Sorted by their seven bands, the readings fell into four clusters: one for each voice and one for silence.
One voice stood apart. The other two sounded very similar.
Whether a space was in use was easy to see;
how well people worked there was not.
“It is easy to see when the corner meeting space is occupied by a meeting, if people are in the kitchen, or if there is activity in the entrance area. … Getting beyond this simple level to a real understanding about workplace performance becomes much more difficult.”
The next hypothesis: counts and sound
might tell what kind of meeting it was.
“Correlating the these two simple datasets could potentially tell if a meeting was informative, generative, evaluative, boring, exciting, working session, conference call, etc.”
In 2014 the platform took up three of those words as its meeting types.
One instrument's log for one day survives,
which is 1 part in 396 of the study.
- Instruments logging
- 9
- Days
- 44
- Instrument-days
- 396
- Found
- 1
Spider 7005, by the front door, on 16 May 2013: 687,167 rows of sound in seven bands, temperature and air pressure.
That log agrees with the report's figure
in its instrument, clock and scale.
Instrument
The rows say 7005, and the report's plan puts 7005 by the front door.
Clock
Its sound lines up with the report's front door lane best within half a minute: r = 0.57, falling to 0.2 two minutes off.
Scale
The lane's height fits the full range of seven bands: 2,687 measured, against 2,707.
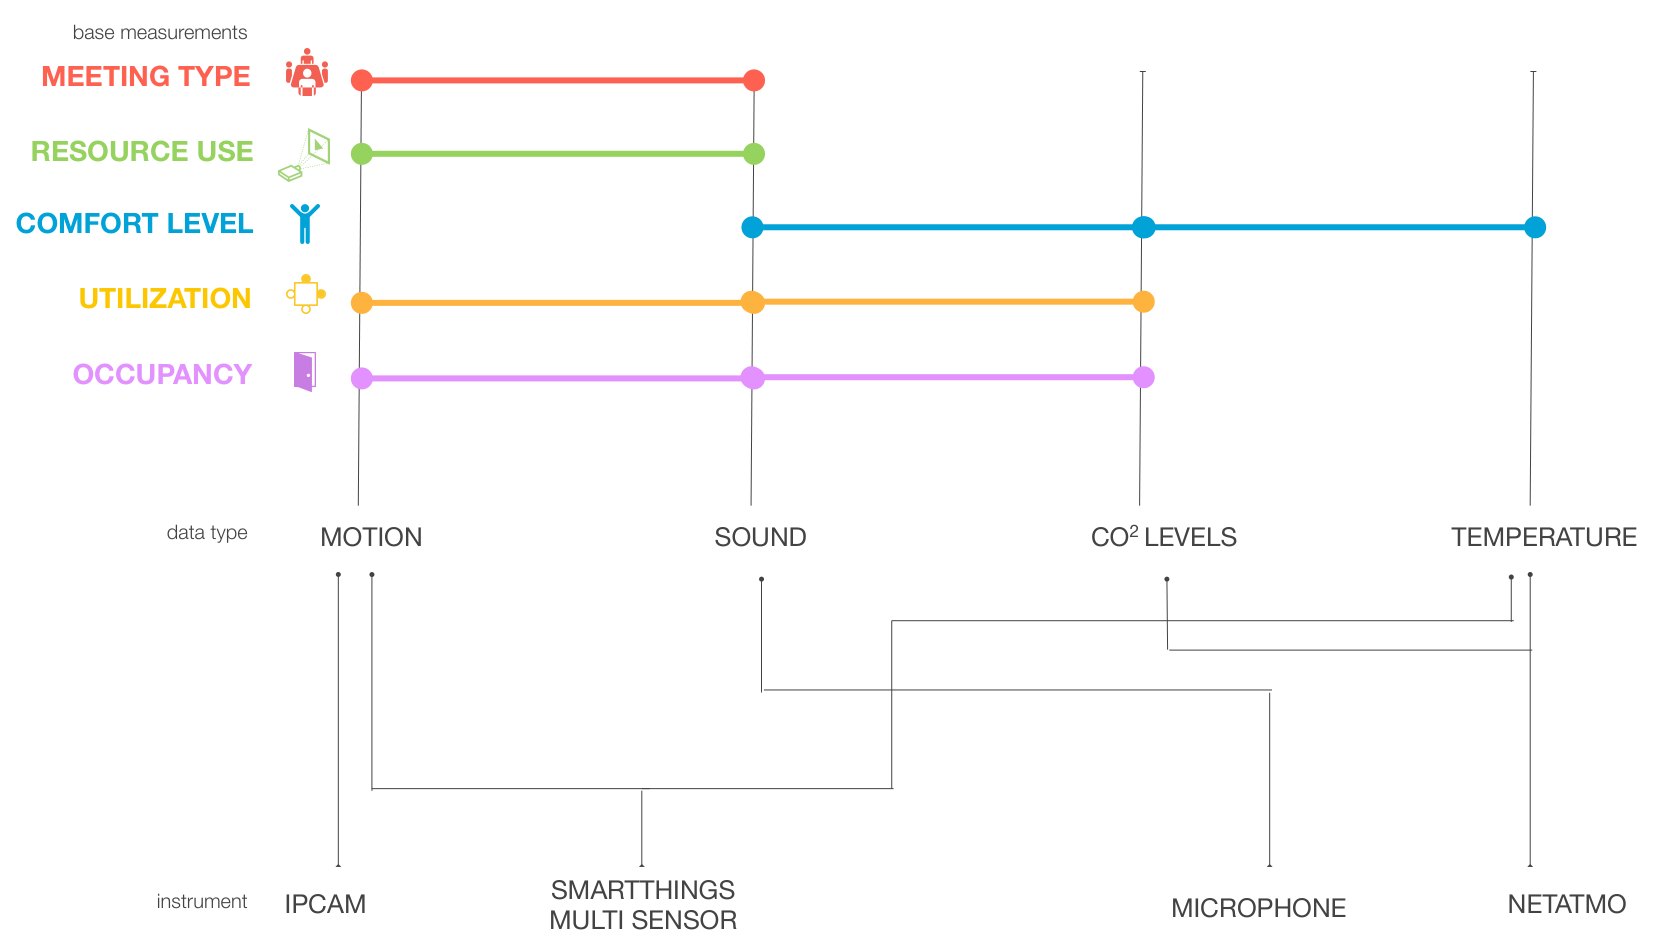
In 2014 the study became a platform,
with five measures from four kinds of data.
Off-the-shelf instruments: IP camera, conference microphone, weather station, SmartThings sensors.
A fingerprint combines sound and motion,
and each 15 seconds gets a type.
Informative: low in both. Evaluative: medium. Generative: high.
Speech and faces were gone by the time a point was made.
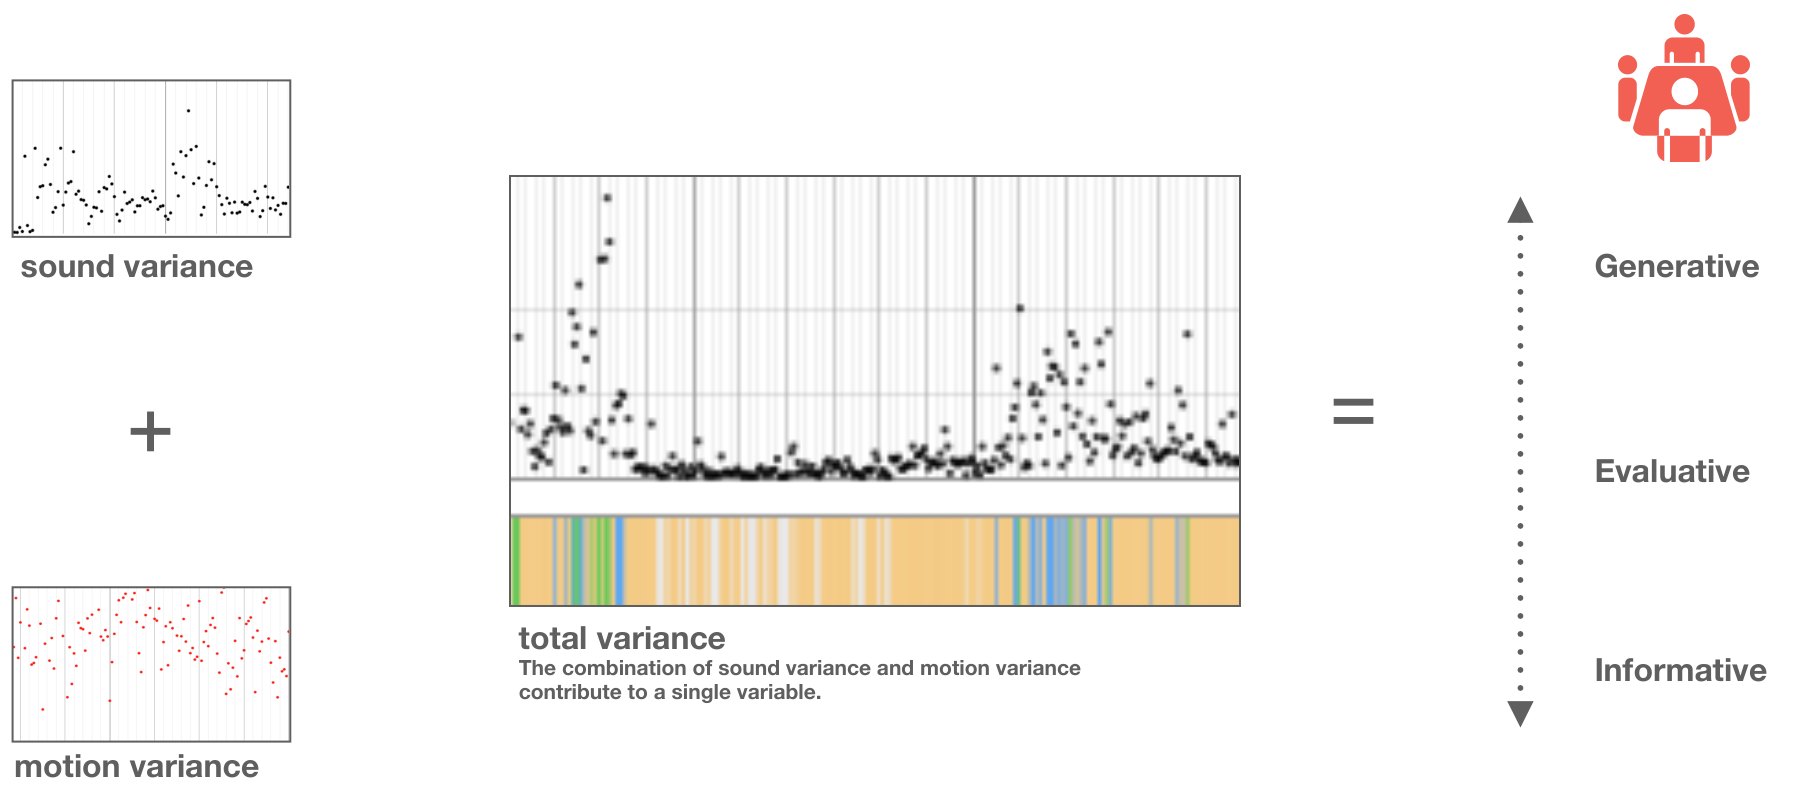
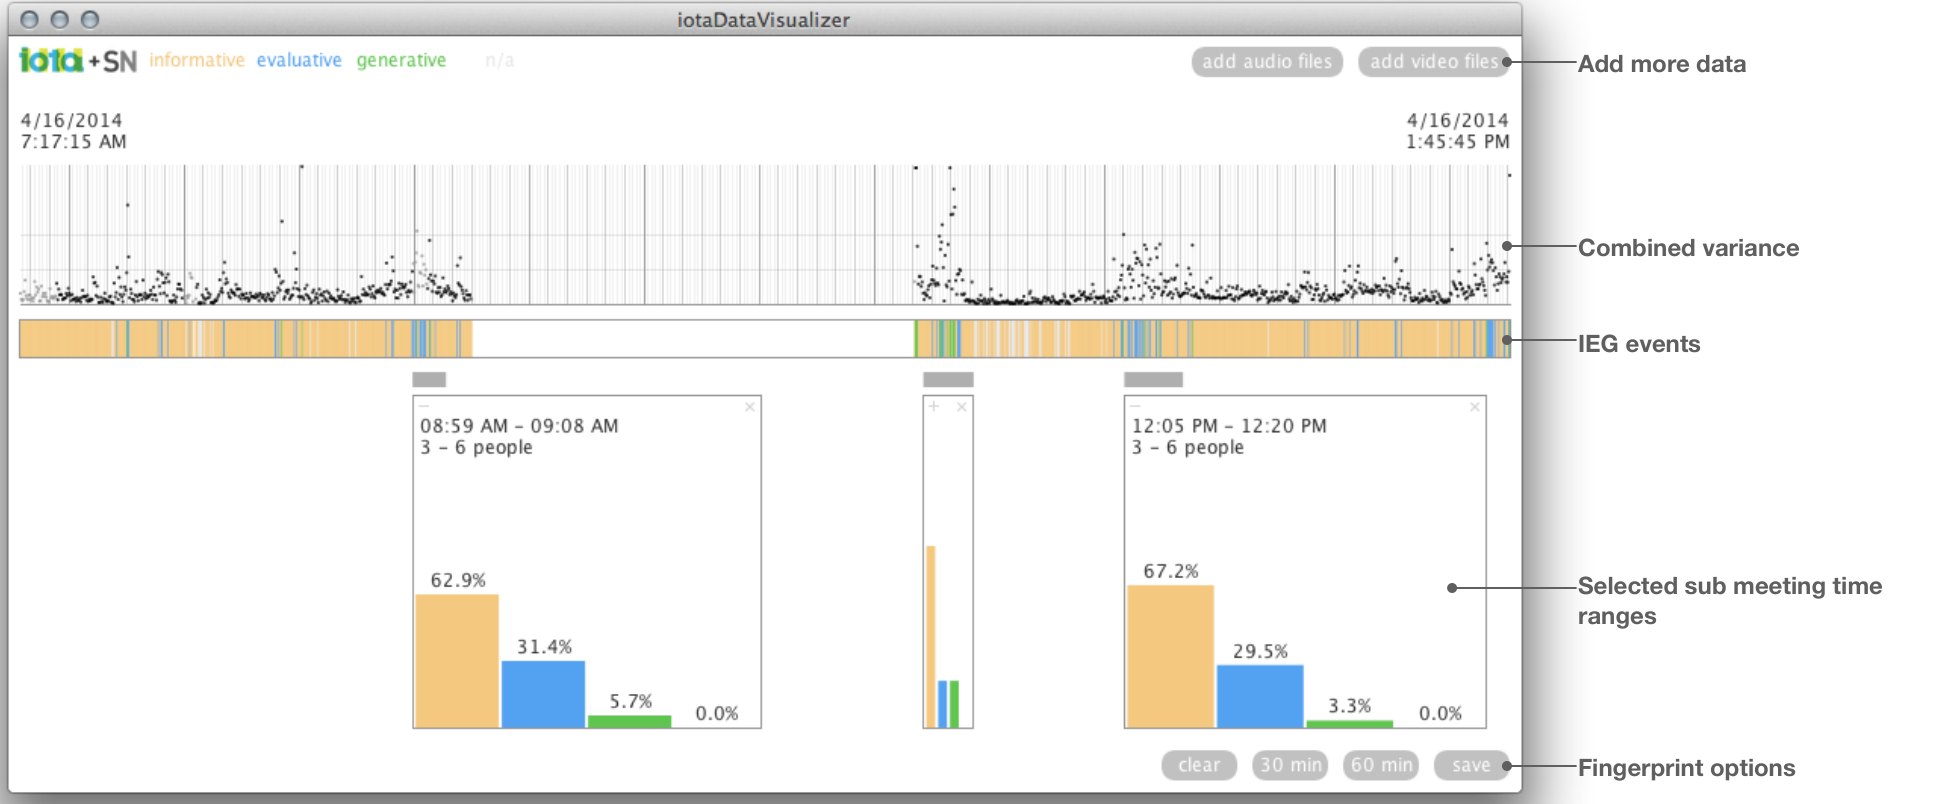
In the deck's example, a recording of April 2014,
two segments read mostly informative.
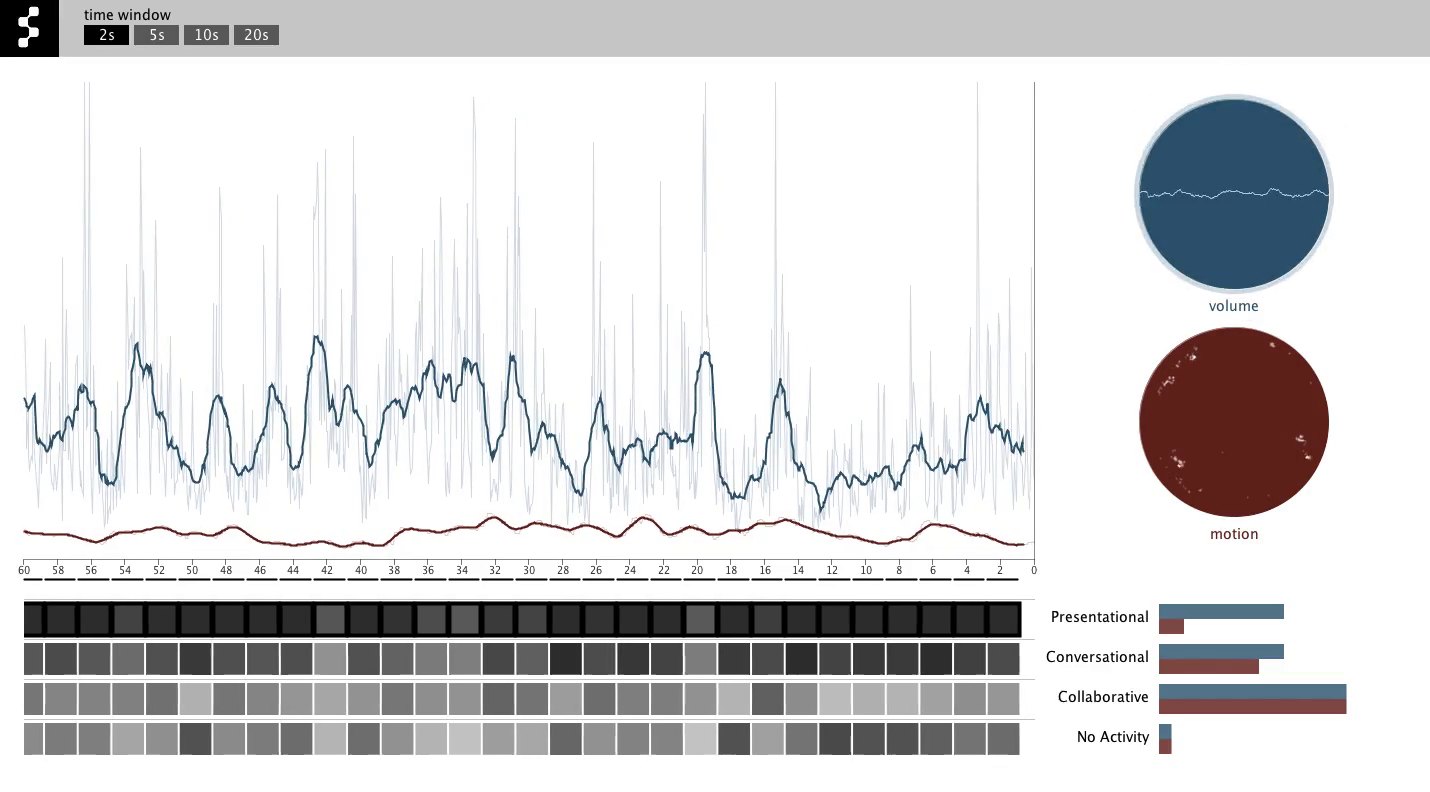
The 2014 demo names a segment
by the nearest of four models.
| Model | Motion | Volume |
|---|---|---|
| Presentational | 200 | 1,000 |
| Conversational | 800 | 1,000 |
| Collaborative | 1,500 | 1,500 |
| No activity | 100 | 100 |
For the surviving day only sound remains,
so nothing here types that day.
In 2014 motion came from a camera. The 2013 study had none of that kind, so a fingerprint can't be made for 16 May.
The page's last lane applies the 15-second step to that day's sound: 5,760 points, marked as added in 2026.
In February 2014, Aaron Otani and Wei Sun
observed one team through four meetings.
“To understand how communication impacts the ‘success’ of team meetings at ID, we will explore the dynamic patterns of conversation, body positions, and movement in the meeting space.”
11 to 25 February 2014, about 3.5 hours each: a Kinect, a microphone for each person, video, and a survey.
They scored each minute of talk against
three models: one way, two way, collaborative.
| Model | Shares of the talking | Switching | Score |
|---|---|---|---|
| One way | 100, 0, 0, 0 | Little | 19 |
| Two way | 50, 50, 0, 0 | Little | 89 |
| Collaborative | 25, 25, 25, 25 | A lot | 131 |
They concluded that movement and sound
are not enough to judge a meeting.
“Our research suggests that tracking movement and audio patterns is not enough to evaluate a meeting as successful or productive, since different types of meetings naturally vary in terms of talking and movement levels.”
Each version of the model sorts meetings
into three kinds.
| Where | The kinds | Made from |
|---|---|---|
| The team's final deck, April 2014 | Informative, evaluative, generative | Sound variance and motion variance; a type each 15 seconds |
| The team's demo, August 2014 | Presentational, conversational, collaborative, or no activity | Volume and motion, against four set values |
| Aaron Otani and Wei Sun, 2014 | One way, two way, collaborative | Each person's share of the talking in a minute, and how often the talk switches |
The 2014 deck names four cases
where the model falls short.
Phone or video meetings
Some people are not in the room: sound comes from one side, and their motion is absent.
Unstable wifi
A new password or a restarted router means the hubs stop saving data.
Privacy and security concerns
The camera can capture faces. The service must be ready to remove instruments.
No calendar data or room audits
The count is then rough, with no exact value.
Sensing could scale, and the other techniques
gave it the context it lacked.
“The sensing could scale where the other techniques could not, the other techniques provided rich context sensing alone could not capture.”
The team validated with a Kinect's photographs, and the students with video.
An instrument's reading is not yet an account
of what people were doing.
“An observation is not an activity model. A sensor may report that a door opened, a cup moved, or someone entered a room, but none of those events alone establishes what the person was doing.”
The deck lists a collaboration coefficient among its signature measures. No value of it has been found.
Everything on these slides traces
to a small set of sources.
- The surviving log, 16 May 2013; the team's analysis scripts, 2013.
- The team's sensor matrix, 3 May 2013; deployment plan, 6 May 2013; analysis deck, 21 June 2013; audio clustering deck, July 2013.
- The team's final report, 27 June 2013, not named further because it names the client; the team's cleaned copy of it, July 2013.
- The team's final deck on the platform, April 2014, in its anonymized copy; Iota, SapientNitro, presentation, 2013.
- The 2014 demo program and its recording, August 2014.
- Aaron Otani and Wei Sun, Observing team meetings at ID: Whitebook, Fall 2013 to Spring 2014.
- TJ, Computational Design, 2026, p. 8; Modeling Activity, 2026, p. 3; Models, Human Action, and Computational Design, 2026, p. 23.