This study instrumented one home
to read the patterns of daily living.
Aging in place: slides. A draft, November 2026.
These slides go from the study's aim
to what survives of it.
- The aim, the anchor and the team's starting points
- The instruments
- The view of the house, live
- The model of activity
- What the study could establish
- What survives
The study set out to see changes in health
through changes in daily living.
“Develop a robust picture of daily living patterns within a specific elderly person’s home, in order to identify changes in behavior, or changes in bodily condition, which may suggest an emerging health problem.”
A baseline was to be the means: “By establishing a “normal” set of behaviors and conditions, we will recognize abnormal conditions which may signify a downturn in health.”
The study's anchor is a place, the home:
its sensors stay, and people come and go.
“If the person leaves the home they are out of the sensor, if guests visit they are also sensed. It is a place, the home. The sensors are fixed to things that stay at home.”
TJ's paper on the three anchors: “attending to a place foregrounds changing presence and use”.
The team began from what motion detectors
and bed sensors could not say.
QuietCare
Motion detectors around the home.
“there is no way to determine WHO is moving through the home”
Aurama
Load sensors under the bed, a presence tag, tablet games.
“what happens after the elder leaves the bed?”
BoxLab
MIT PlaceLab's second iteration, in volunteers' own homes.
“dense, multi-modal sensor records” over four months
The list of what to track came from
two assessments, with signifiers added.
ADLs
Bathing, dressing, toileting, transferring, continence, feeding.
The Katz index
IADLs
Telephoning, shopping, food preparation, housekeeping, laundry, mode of transportation, medication, finances.
The Lawton scale
Signifiers
Weight gain, sleep habits, well-being: emotional, physical, mental.
The team listed eight kinds of sensor,
and used those it had already built.
Six instruments went in over two visits.
First saved 19 December 2012. A Kinect on its own computer; a second computer with a Grid-EYE and two spiders.
Second visit, saved 7 January 2013. Two more spiders, in the bathroom and the bedroom, which also tried wireless.
Phase two was a plan: load cells under the bed and a chair, a Kinect in the kitchen, a power monitor on the television.
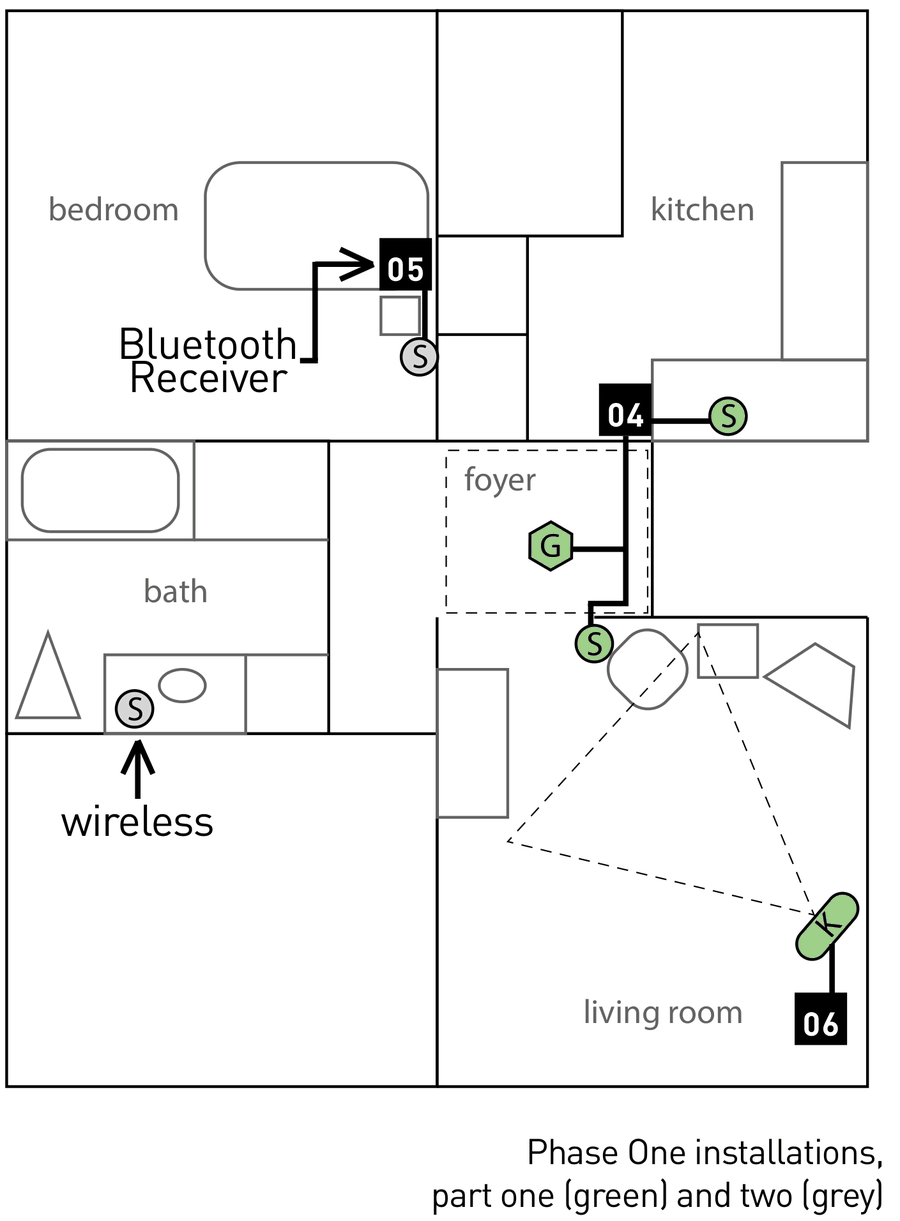
The saved placements land in the rooms
the publication names, once y is negated.
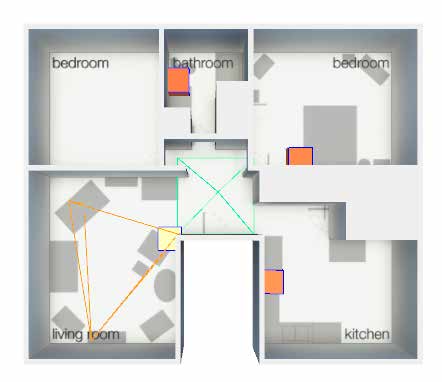
The page's plan lines up with the first frame
of the team's film.
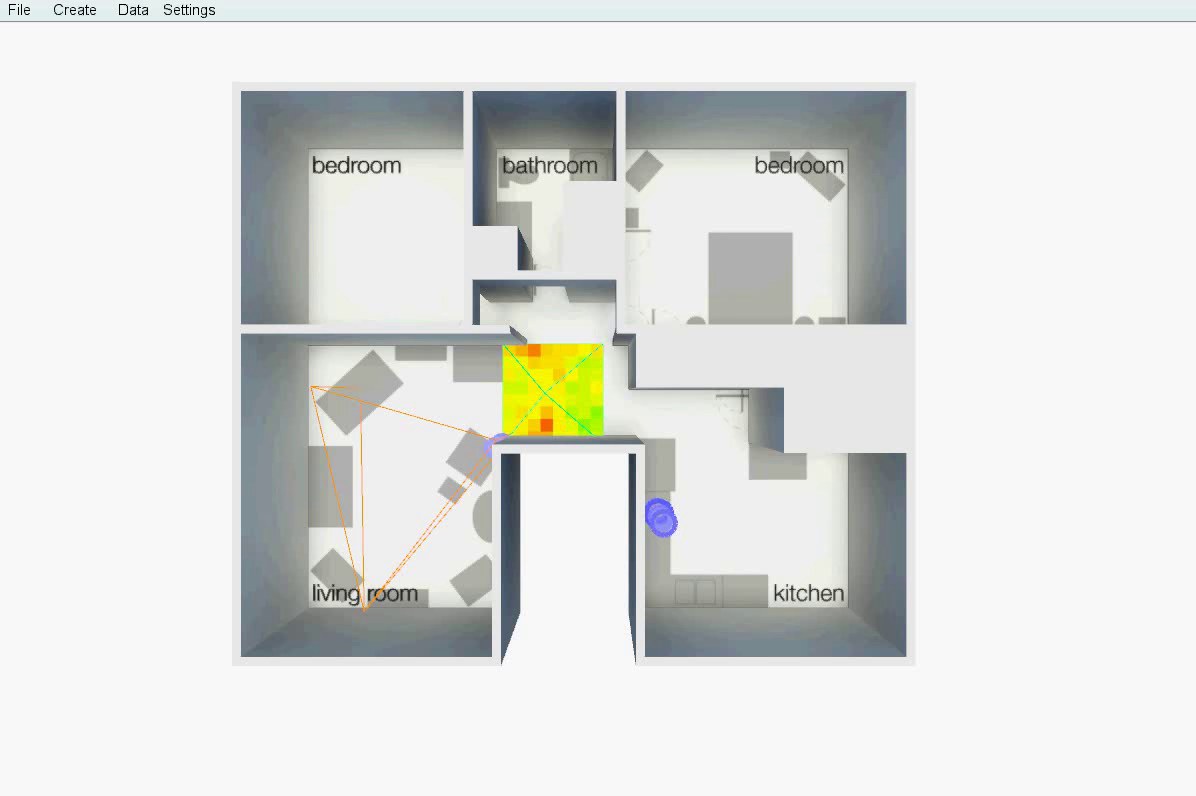
The model's first form assigns each activity
to a room and a sensor.
| Room | Focus activities | Instrument |
|---|---|---|
| Foyer | Transferring | Grid-EYE 2000 |
| Living room | Transferring, TV-watching | Kinect 2003 |
| Living room | Telephoning, transferring | Spider 2001 |
| Kitchen | Feeding and food prep | Spider 2002 |
| Bathroom | Bathing, toileting | Spider 2004 |
| Bedroom | Sleep habits | Spider 2005 |
Each assignment reads an activity
through something a sensor can measure.
Bathroom
Humidity and sound, for bathing.
Kitchen
Sound and temperature, for feeding.
Bedroom
Light and a regular sound, for sleep.
“An observation is not an activity model. A sensor may report that a door opened, a cup moved, or someone entered a room, but none of those events alone establishes what the person was doing.”
Seven of the nineteen listed items
reached an installed instrument.
The other twelve had no installed instrument,
so the model is silent on them.
Six had nothing assigned: continence, shopping, housekeeping, laundry, transportation, finances. Dressing and medication had a room, weight gain a plan, and well-being further study.
“They are necessarily partial, reflecting the limits of perception, instrumentation, available knowledge, and the assumptions embedded in their construction.”
The publication reads a few things
from its graphs.
- In the bathroom, with trial data, humidity spikes as showers.
- In the bedroom, light that tells a lamp, a ceiling light and daylight apart.
- In the foyer, a person's path through the heat, and a radiator as a fixed spot.
It ends at early analysis, with no baseline
and no change in health reported.
- It asks whether a sound in the bathroom was someone using it or other noise, and whether the lights had been left on.
- Feeding, from sound and temperature, is what “we hope to be able to determine”.
- Where someone was going, and why, is what “we may assume”.
Keeping the instruments connected
took daily attention.
- XBee radios “could not consistently push data more than 5 feet”.
- Bluetooth reached farther, but “the devices must be checked on a daily basis through Remote Desktop”.
- The bedroom's spider went back to a wire after two days.
The readings have not been found;
the model, placements, viewer and film have.
| Readings | Kinect, Grid-EYE and spider, and the daily files made from them: not found |
|---|---|
| Model and viewer | The house in two parts, the viewer's source and its spiders' firmware, December 2012 |
| Placements | Four saved files, three of them different, 19 December 2012 to 7 January 2013 |
| Film | The viewer at work, 110 s, 10 January 2013 |
| Publication | 33 pages, November 2013 |
The dates are file dates, and the team's decks
describe a longer project.
Dec 2012 – Jan 2013
The model, firmware, placements and film. The publication's graphs run to 13 January 2013.
“Multi-year”
“over 3.2TB of data” in a team deck of 2013, “over 6TB” in one of 2014.
August 2014
A folder of sensor logs shares the study's old name. Whether the home was used again, or only the name, is not known.
What survives is a plan of what to sense,
without the readings to test it.
- What remains is a house, six instruments, nineteen items and the reasoning that joins them.
- If the readings are found, this view can replay them: the viewer's drawing rules are known, and the open house page uses them.
- The best lead for the readings is the team's own archive.
The sources are the team's publication,
its viewer's files and its decks.
- Iota. Iota's elder care publication, 2013, 33 pp. Quoted only where it does not name the resident.
- The team's viewer, December 2012: source, house model, saved placements. Spider firmware, 21 December 2012. A film of the viewer, 10 January 2013.
- SapientNitro. IOTA Partners Overview, 2014, pp. 19–20. A team presentation, 2013, p. 40. Method sheets, 2013, p. 4.
- McLeish, T. J. Computational Design, 2026, pp. 1, 8. Modeling Activity: Computational Design and the Opportunity for AI Applications, 2026, p. 3.
- Legorburu, G., and D. McColl. Storyscaping: Stop Creating Ads, Start Creating Worlds. Wiley, 2014, ch. 8, “In Their Shoes”, pp. 143–164, which discusses Iota's work with sensing.